This is a community guide and is not officially supported. If you have any issues, please reach out to the author.
Important for users with low-powered server (1GB RAM):
This setup will increase the use of your server RAM.
Configuration
Traefik
For claiming metrics from Traefik we have to adjust some configuration files.- Udpate the
docker-compose.ymlfile of the Pangolin stack to expose metrics port8082for the Prometheus connection:
Docker’s NAT-based port publishing feature automatically exposes all
ports: defined in docker-compose file. This behavior can bypass your host firewall settings, potentially exposing services that you did not intend to make public.
Please see complete warning about exposing ports.- Update the
/config/traefik/traefik_config.ymlfile to include the following:
- Restart the Gerbil and Traefik container to apply the changes:
Crowdsec
For claiming metrics from Crowdsec we have to adjust the docker compose files.- Udpate the
docker-compose.ymlfile of the Pangolin stack to expose metrics port6060for the Prometheus connection:
Docker’s NAT-based port publishing feature automatically exposes all
ports: defined in the docker-compose file on all network interfaces. This behavior can bypass your host firewall settings, potentially exposing services that you did not intend to make public.
Please see complete warning about exposing ports.- Restart the Crowdsec container to apply the changes:
Prometheus
- Create a new Prometheus container or add it to
docker-compose.ymlof Pangolin stack:
Docker’s NAT-based port publishing feature automatically exposes all
ports: defined in the docker-compose file on all network interfaces. This behavior can bypass your host firewall settings, potentially exposing services that you did not intend to make public.
Please see complete warning about exposing ports.- Create a
prometheus.ymlfile in the/config/prometheusdirectory with the following content:
- Create a folder
datain/config/prometheusand change the ower and owning group:
- Start the Prometheus container:
Grafana
- Create a new Grafana container or add it to
docker-compose.ymlof Pangolin stack:
Docker’s NAT-based port publishing feature automatically exposes all
ports: defined in the docker-compose file on all network interfaces. This behavior can bypass your host firewall settings, potentially exposing services that you did not intend to make public.
Please see complete warning about exposing ports.- Start the Grafana container:
Default login credentials for Grafana admin user is admin:admin.
Add Prometheus Connection
Add the Prometheus connection under Connections -> Add new connection. Sethttp://172.17.0.1:9090 as Prometheus Server URL and click Save & test.
Add Dashboard
Add a Dashboard under Dashboard -> New -> Import and import a pre configured Dashboard or create your own.Traefik
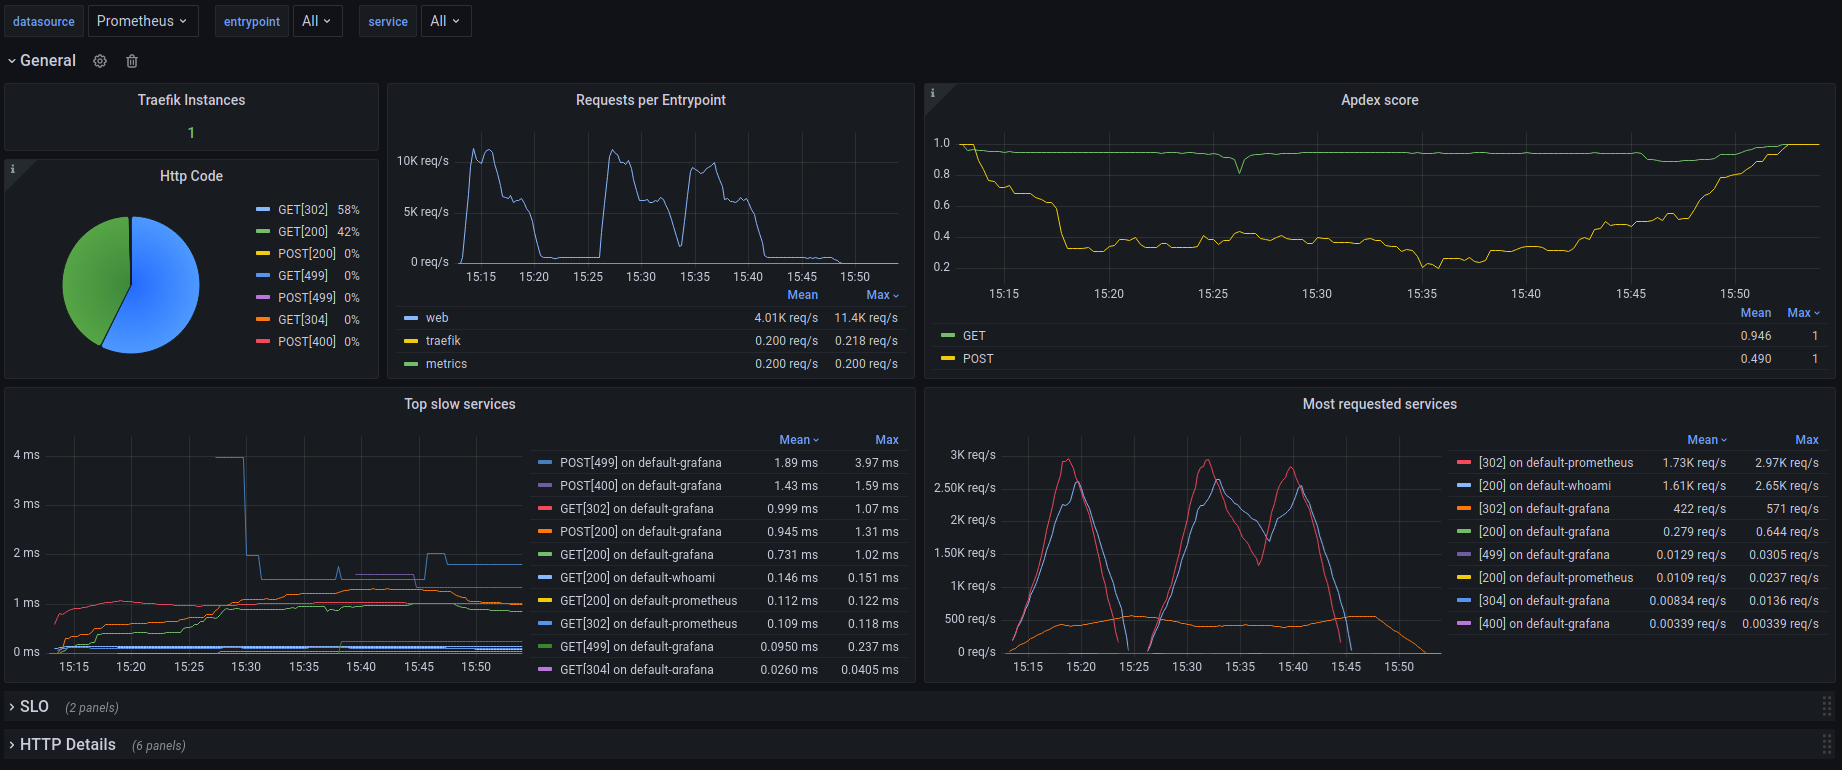
Traefik Dashboard